Analytical recording of the hygiene – climatic process environment
“The process environment:
a field where buried treasure is hidden.”
Initial situation and analytical recording of the hygiene-climatic process environment
In the current situation of sharply rising costs for goods, personnel and energy, but also the extended hygiene requirements (food safety culture), the pressure on food businesses to take “precautions and measures” has increased significantly.
The aim here is to reduce and prevent the “adverse influence” of microbiological and climatic risk potentials (often the cause of hygiene risks) emanating from buildings, facilities, equipment, but also from staff and the products themselves.
However, before the RIGHT measures and precautions can be taken, the existing situation must be recorded and evaluated during operation.
For this purpose, a targeted cluster analysis can be carried out in line with the process flow to carry out a manifesting hygiene risk analysis, also based on BCR / IFS, in order to recognise possible risks in advance and take appropriate measures before damage occurs.
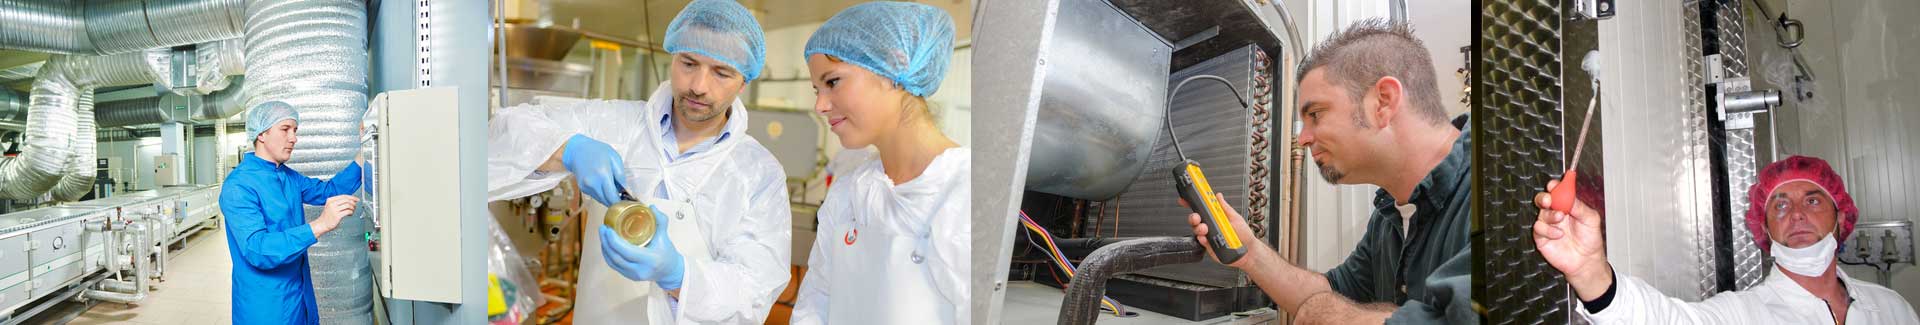
Using simple scientific methods, we can record all influences on your product in the process environment in the shortest possible time.
To do this, we use standardised measurement methods that we apply during production, which makes the real threat visible and is not limited to cleaning and disinfection checks.
In addition to measuring airborne germs using air samplers, we also go through the surfaces with contact tests along the product path, electronically record the longer course of air humidity and air temperature and visualise the prevailing air currents.
Description of a hygiene – climatic process environment data acquisition / cluster investigation (actual condition survey)
The process environment in the food industry
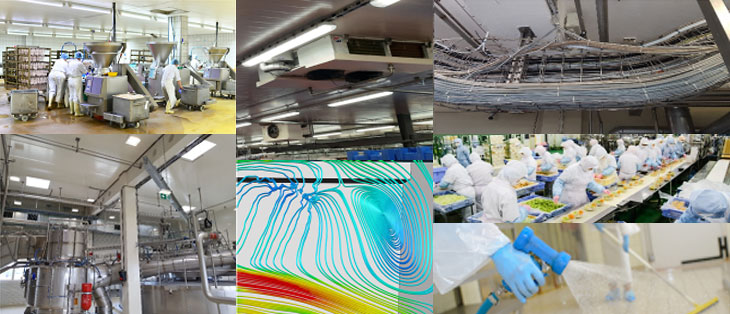
Metrological analysis of the process environment
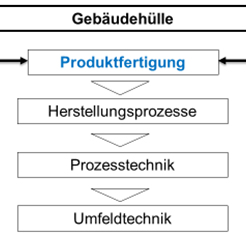
In addition to the individual process areas with the detailed production sequences, the technical building design, the ventilation requirements and the directly neighbouring areas are also recorded and evaluated in line with the process flow.
The cluster analysis includes:
- the analytical recording / evaluation of process sequences / process technology
- the rough assessment of the building structure
- the rough assessment of the existing air conditioning / ventilation technology
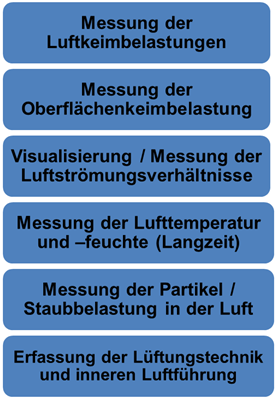
Possible contamination risks with microorganisms or as a basis for allergen management are also recorded:
- Airborne germ measurements (H & S, as well as GKZ)
- Surface swab tests (H & S, as well as GKZ)
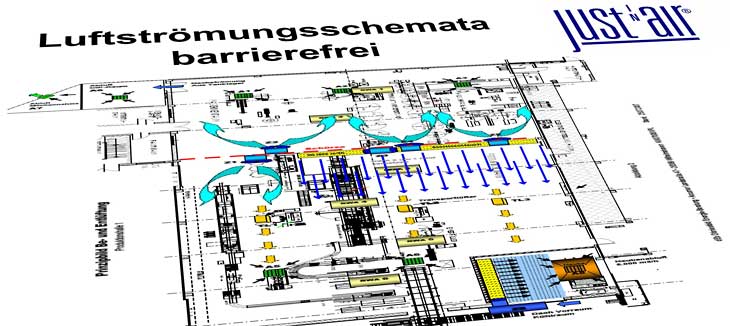
- Airflow visualisation
- Detection of internal loads such as moisture, dust, etc..
The analyses are carried out linearly to the process sequence.
The cluster analysis evaluates possible hygiene and climatic weak points as well as alternating influences from neighbouring areas and classifies them according to risk potential.
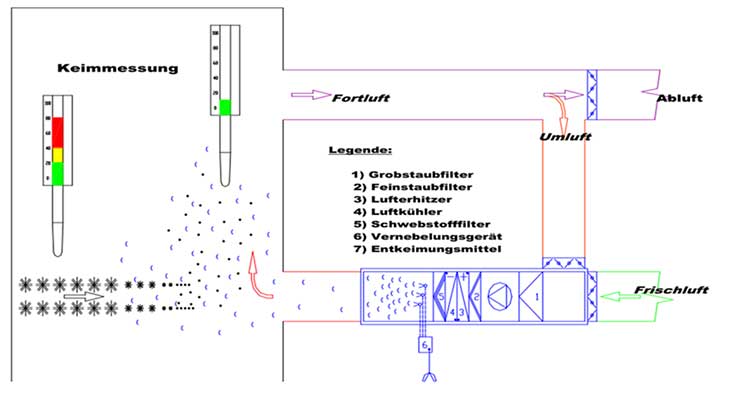
Based on the analytical recording of the process sequences, taking into account the existing building design, such as the existing ventilation technology (supply air, exhaust air, recirculation cooling), conclusions can be drawn about the hygienic and climatic effects (air flow patterns, germ carry-over, etc.) and recommended optimisation proposals can be drawn up.
This fundamental basic information also provides an important basis for an action plan for customised hygiene and air management, which is also a basis for targeted allergen management.
The measurements are carried out and the assessment recorded at the client’s premises, while the analyses, reports, etc. are prepared at Just in Air® Bremen.
Scope of services
- Recording of the production processes and process steps
- Orientating evaluation of the existing air management, ventilation technology (supply / exhaust air), process / environmental technology and process sequences
- Consideration of the existing building technology
- Rough recording of the moisture load generated in the room during production and cleaning using data loggers
- Measurement of airborne germ loads on GKZ & HS at relevant positions
- Measurement of the surface germ load on GKZ & HS at relevant positions ( GKZ = total germ count / HS = yeasts & mould )
- Optical measurement of the dust load in the room air at relevant positions
- Coordination of the environmental parameters to be recommended in limit values (air temperature, humidity, airborne germs, etc.)
- Recording the influences of neighbouring areas (corridors, adjoining rooms, etc.)
- Recording of spatial and environmental anomalies
- Reporting and presentation of the results, presentation of approaches for optimisation
Description of implementation
When recording process data for the hygienic and climatic environmental parameters, these are recorded according to standardised reference values.
- Airborne germ collections at relevant positions
- Recording of the surface bacterial load at relevant positions
- Course of the room temperature over several days using a data logger
- Relative humidity curve over several days using a data logger
- Visualisation of the existing air flow conditions
- Optical measurement of dust particles in the air at relevant positions
- Calculation of the air balance from supply and exhaust air volumes
- Rough assessment of the existing ventilation technology (old stock)
Airborne germ measurements
Quantitative airborne germ measurements for yeasts and mould
Quantitative airborne germ measurements for total germ count
Analysis:
| Total germ count: | Plate-Count-Agar (according to APHA) |
| Yeasts and mould: | Sabouraud-4%-Glucose-Selektivagar with Chloramphenicol |
Method:
- Air sampler MERCK MAS – 100® ECO; Fa. MERCK KGaA
- Collection volume: 200l
Incubation / evaluation:
| Total germ count: | + 32°C / 48 h |
| Yeasts and mould: | + 23°C / 96 h |
Illustration:
- Colony forming units (KBE) per cubic metre (m3) of air
Pictures Gallery Airborne germ measurements


Contact samples
Quantitative surface contamination measurement for yeasts and mould
Quantitative surface contamination measurement for total bacterial count
Examination:
| Total germ count: | TC – Agar |
| Yeasts and mould: | SDX – Agar |
Method:
- Surface swab on 25 cm2 sample area
Incubation / evaluation:
| Total germ count: | + 32°C / 48 h |
| Yeasts and mould: | + 23°C / 96 h |
Illustration:
- Colony forming units (KBE) per cubic metre (m3) 252 cm
Images Gallery samples


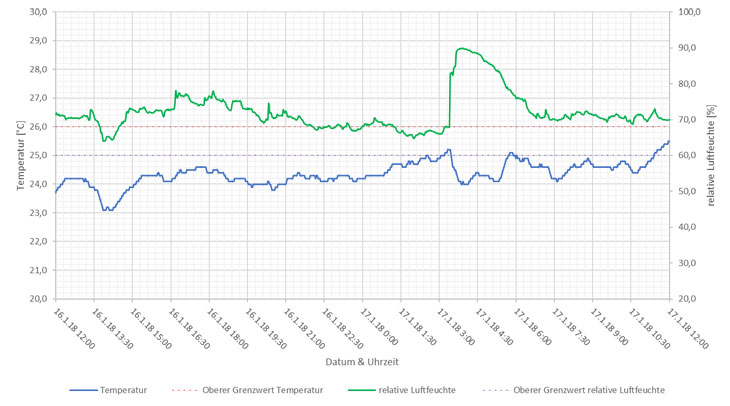
Measurement of the course of room temperature and relative humidity
The room temperature and relative humidity are recorded over several days using a Dostmann data logger (LOG 32 TH).The LOG 32 TH data logger measures the room temperature and relative humidity at five-minute intervals and then displays them as a graph. Recording of temperature and humidity curve by data logger.


Visualisation of the temperature and humidity curve
Measurement of air flow conditions / visualisation of air flows
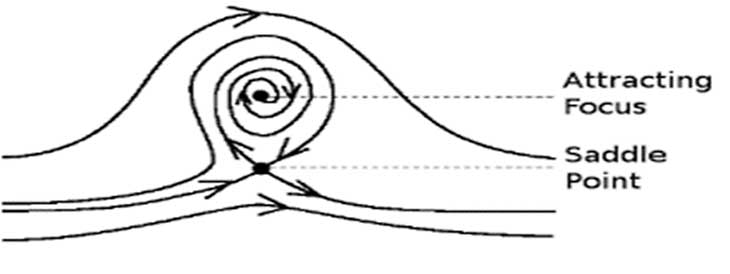
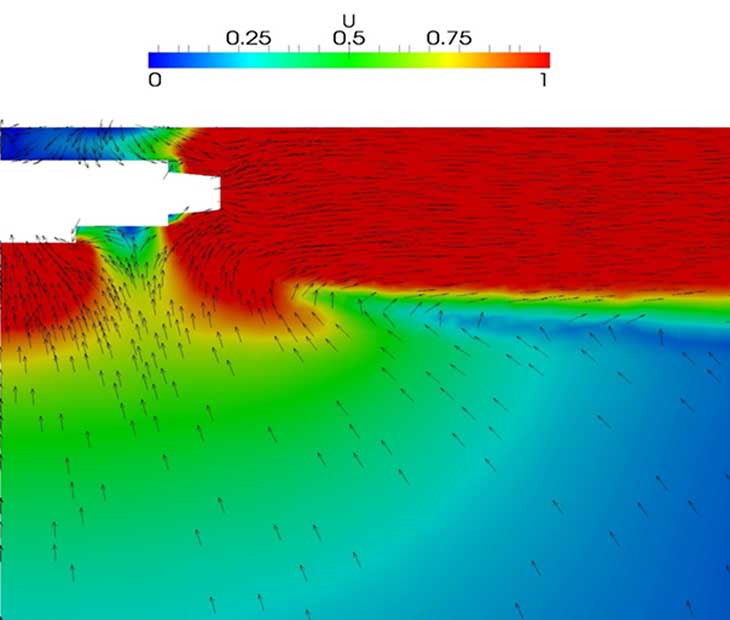
The prevailing air flow conditions in the relevant areas are recorded using a smoke plume nebuliser (Dräger air flow tester CH 216) and air flow anemometers. These are used to determine the qualitative and quantitative air flows and as an indicator of possible internal entrainment by the air flows.


Optical measurement of dust particles in the air
The dust concentrations for determining possible emission sources are recorded using the BQ20 optical particle analyser to quantitatively determine the concentration of E and A dust.
- Detectable particle sizes: 2.5 – 10 μm
- Measuring range mass concentration (PM 2.5): 0 ~ 2000 μg / m³
- Measuring range mass concentration (PM 10): 0 ~ 2000 μg / m³


Technical recording of the air management / existing ventilation technology
Based on the existing ventilation technology (supply / exhaust air), the design for air conditioning (filtering, cooling / heating capacity), air volumes and air exchange rates, the influence of air management on process / environmental hygiene can be roughly evaluated.


How can we help you?
We will be happy to answer your questions and talk to you about individual requests and measures.
Please do not hesitate to contact us.